
4 min read
Nginx, Loki, Promtail and Grafana
Hey devops engineer, you don’t need Logtail, Sentry, Datadog or any other SaaS/PaaS service to manage your logs. Collecting and analyzing log files is super easy with the LPG-stack. Another acronym that stands for Loki, Promtail and Grafana.
I will give you a brief overview of how you can deploy the LPG-stack and label your log entries with Promtail. To sum it up we will have look at Grafana and see how we can query the log data
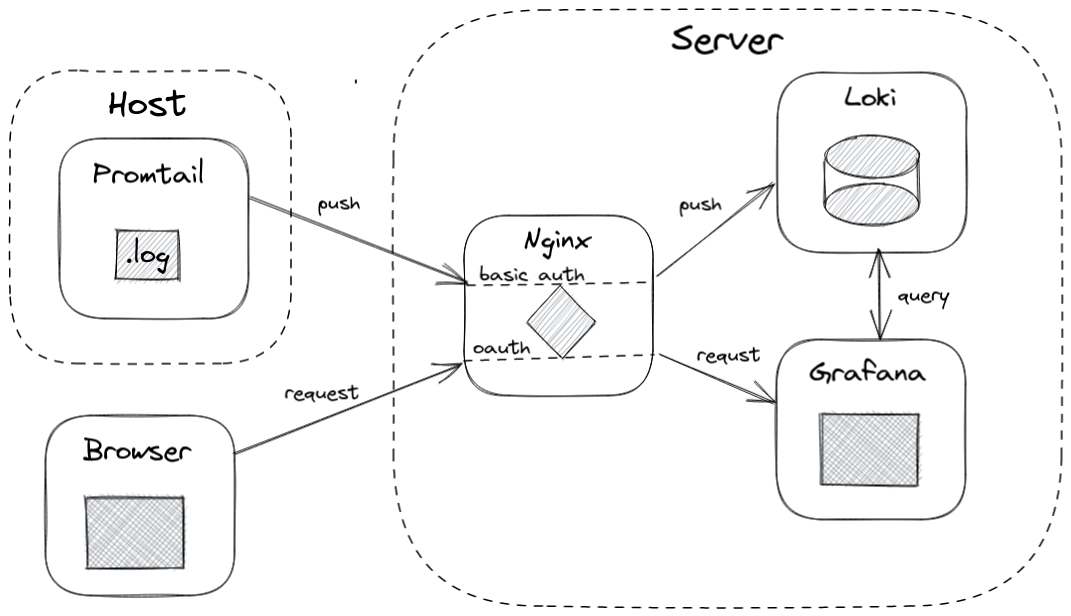
Usually you would follow these four steps to setup the log monitoring system:
- Setup loki for indexing log data
- Setup nginx reverse proxy to expose loki with basic auth
- Configure promtail and forward logs on host
- Create a dashboard in grafana and query the data
However, giving details on the full setup would make this post unnecessarily long. That is why I added a note Not covered: note to every section. The deployment of these services depends heavily on the technology (f.g. Kubernetes, Docker Compose or Ansible) you are using. I will fokus on the most important part - the config files.
Loki
Not covered: Deployment and configuration of the Loki container.
Loki manages the log index. It receives the log files from Promtail and acts as a datasource for Grafana.
The configuration below is based on the official template and has not been altered notably.
local-config.yml
# https://github.com/grafana/loki/blob/v2.3.0/cmd/loki/loki-local-config.yaml
auth_enabled: false

server:
  http_listen_port: 3100
  grpc_listen_port: 9096

ingester:
  wal:
    enabled: true
    dir: /tmp/wal
  lifecycler:
    address: 127.0.0.1
    ring:
      kvstore:
        store: inmemory
      replication_factor: 1
    final_sleep: 0s
  chunk_idle_period: 1h       # Any chunk not receiving new logs in this time will be flushed
  max_chunk_age: 1h           # All chunks will be flushed when they hit this age, default is 1h
  chunk_target_size: 1048576  # Loki will attempt to build chunks up to 1.5MB, flushing first if chunk_idle_period or max_chunk_age is reached first
  chunk_retain_period: 30s    # Must be greater than index read cache TTL if using an index cache (Default index read cache TTL is 5m)
  max_transfer_retries: 0     # Chunk transfers disabled

schema_config:
  configs:
    - from: 2020-10-24
      store: boltdb-shipper
      object_store: filesystem
      schema: v11
      index:
        prefix: index_
        period: 24h

storage_config:
  boltdb_shipper:
    active_index_directory: /tmp/loki/boltdb-shipper-active
    cache_location: /tmp/loki/boltdb-shipper-cache
    cache_ttl: 24h         # Can be increased for faster performance over longer query periods, uses more disk space
    shared_store: filesystem
  filesystem:
    directory: /tmp/loki/chunks

compactor:
  working_directory: /tmp/loki/boltdb-shipper-compactor
  shared_store: filesystem

limits_config:
  reject_old_samples: true
  reject_old_samples_max_age: 168h

chunk_store_config:
  max_look_back_period: 0s

table_manager:
  retention_deletes_enabled: false
  retention_period: 0s

ruler:
  storage:
    type: local
    local:
      directory: /tmp/loki/rules
  rule_path: /tmp/loki/rules-temp
  alertmanager_url: http://localhost:9093
  ring:
    kvstore:
      store: inmemory
  enable_api: true
Nginx reverse proxy
Not covered: Full nginx config with https server definition.
The Nginx proxy terminates https connections and ensures the connections to Loki are authenticated with basic auth.
The configuration below shows the proxy configuration for Loki.
loki.nginx
location /loki/api/v1 {
    auth_basic "loki";
    auth_basic_user_file /etc/nginx/conf.d/proxies/loki.htpasswd;
    proxy_pass http://loki01:3100/loki/api/v1;
    include /etc/letsencrypt/proxy-params.conf;
}
Promtail
Not covered: Deployment of the Promtail container.
Promtail has access to the log folder of the host machine. It extracts all log data and forwards the content to Loki.
Promtail has been configured to use basic auth and extract Docker log files. Before sending the log files it processes and labels the log lines.
config.yml
server:
  http_listen_port: 9080
  grpc_listen_port: 0

positions:
  filename: /tmp/positions.yaml

clients:
  - url: https://loki:ohs24234ch5vahz5ieVei@monitor.example.com/loki/api/v1/push

scrape_configs:
- job_name: containers
  static_configs:
  - targets:
      - localhost
    labels:
      job: containerlogs
      instance: server.example.com
      __path__: /var/lib/docker/containers/*/*log

  pipeline_stages:
  - json:
      expressions:
        output: log
        stream: stream
        attrs:
  - json:
      expressions:
        tag:
      source: attrs
  - regex:
      expression: (?P<container_name>(?:[^|]*[^|])).(?P<image_name>(?:[^|]*[^|]))
      source: tag
  - timestamp:
      format: RFC3339Nano
      source: time
  - labels:
      #tag:
      stream:
      container_name:
      image_name:
  - output:
      source: output
Ensure docker containers are deployed with these log options:
"LogConfig": {
	"Type": "json-file",
	"Config": {
		"max-file": "3",
		"max-size": "10m",
		"tag": "nginx03|nginx"
	}
},
Grafana
Not covered: Deployment of the Grafana container.
Grafana is our monitoring tool. It visualizes the data from Loki. Getting the data requires settings up a data source.
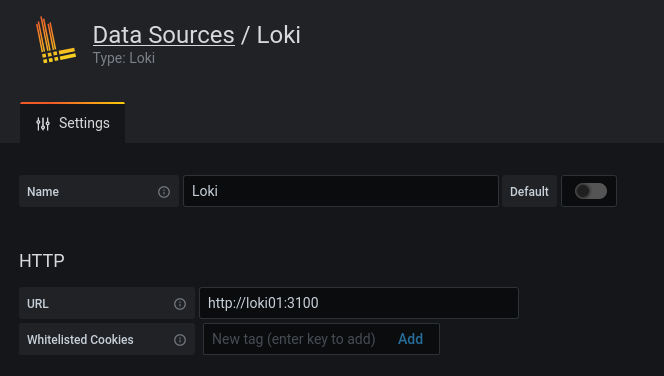
If the connection is private, there is no need for authentication.
In the Grafana data explorer the log data can be queried:
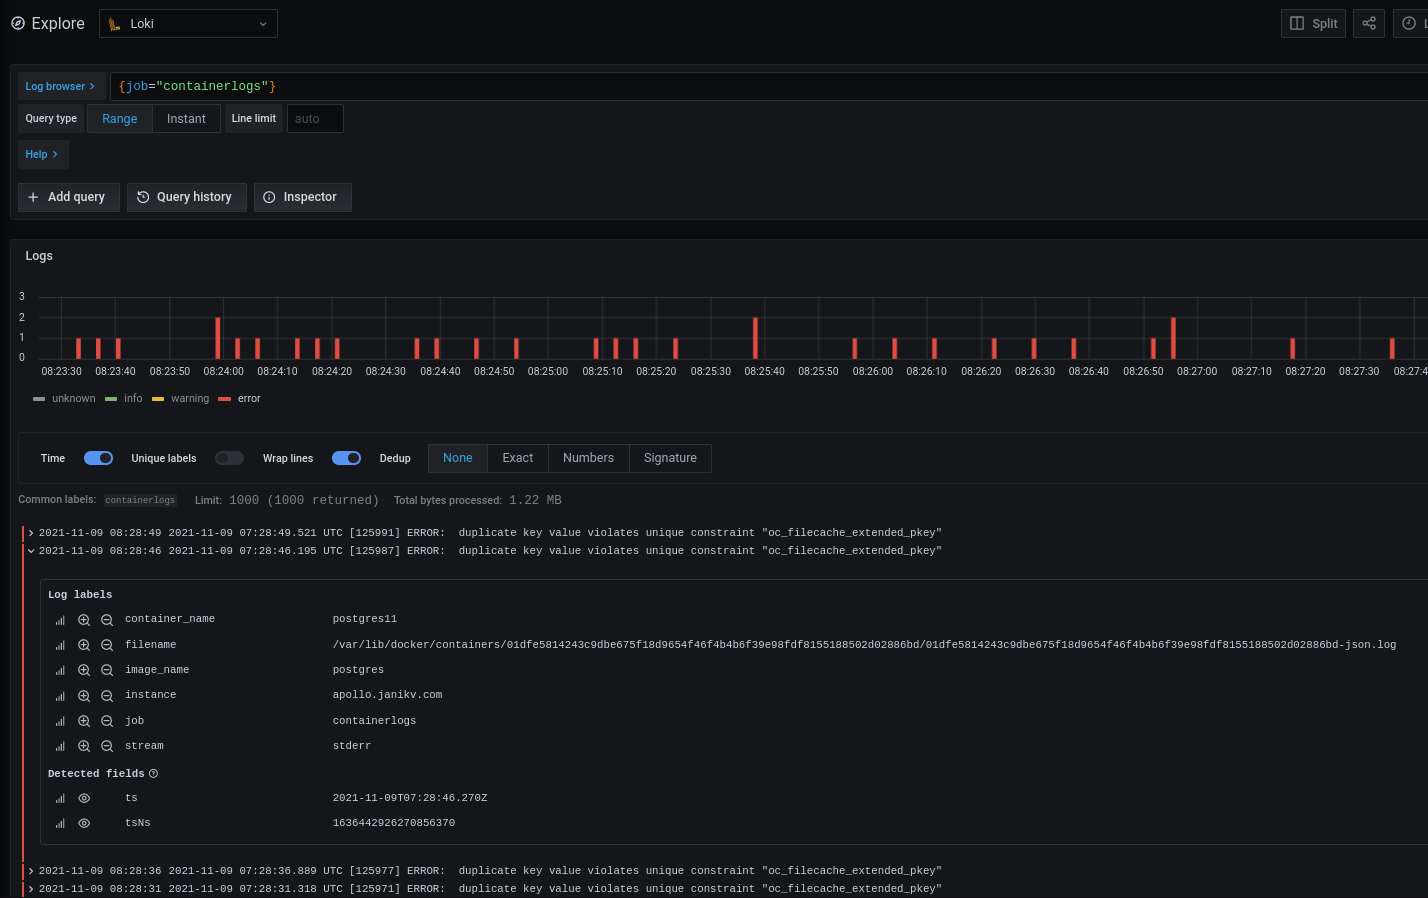
With queries like rate(({job="containerlogs"} |= "error")[1m]) the frequency of errors within a time range will be returned.
Finally, you could setup an alert for a certain threshold on the frequency quer.
Category: system-engineeringTags: grafana , loki , promtail , nginx , devops
Edit Page / Show Statistic