1 min read
Add Prometheus instance variable to Grafana query
Prometheus stores the instance or host name for every metric. If you want to filter your dashboard data based on the instance name you need a Grafana variable.
Open the Grafana, select your dashboard and navigate to Settings > Variables. Create a new variable:
Name: isntance
Typoe: Query
Lable: Instance
Data source: Prometheus
Query: label_values(instance)
Include All option: true
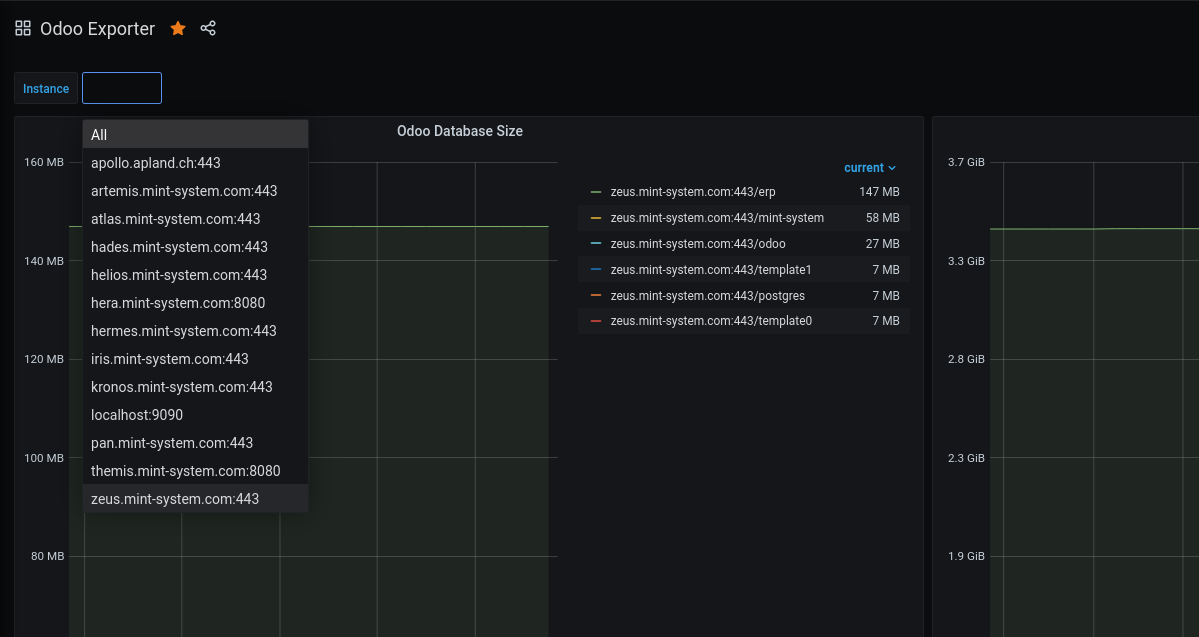
Check if the preview returns the instances.
Next open a panel and insert {instance=~"$instance"} into your metric like this:
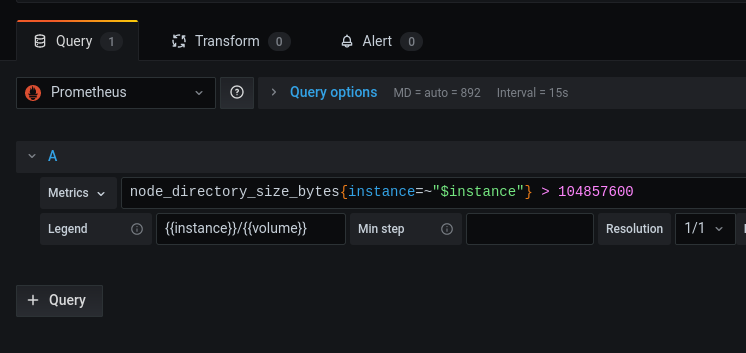
Now all the panel data will be filtered by whatever is set for the variable.
Update 2021-09-06
You can also add filters to the query. Use the label_values({job!="blackbox"},instance) query to return labels for instances that are not monitored by a blackbox exporter.
Tags: grafana , prometheus
Edit Page / Show Statistic