
6 min read
Raspberry Pi thermometer that connects from anywhere via broadband
This tutorial is about how to build an online accessible thermometer using the Raspberry Pi 3 B-model.
We will start by buying the electronic components and finish with a chart showing the temperature data.
Walking through the tutorial requires basic knowledge in working with linux and advanced knowledge in building web applications. Whereas the web application part is optionally.
Using a mobile broadband connection and a thermo sensor our Raspberry Pi will measure the temperature and save it to a graphql server.
Using react and a graphql client library we will create a chart with the temperature data.
Hardware
This is my hardware shopping list.
- Raspberry Pi 3 Model B
- MicrosSDHC Card 32 GB
- USB-C cable to power the Raspberry
- HDMI cable
- Mouse and keyboard
- Housing for the Raspberry
- Thermo sensor DS18B20+
- Adafruit breadboard PCB (optionally)
- 4.75k ohm resistor
- Jumper wire kit
Altitude Tech IoT Bit AntennaAltitude Tech IoT Bit GSM HAT for the Raspberry Pi- IoT SIM card
- Mobile broadband router
All this components should be available from your favorite electronics shop.
Edit: I was not able to setup the GSM hat. The provided code by Altitude did not work: Github - Missing timeout assignment issue. As an alternative I bought the Huawei E5330 - Mobile broadband router. For more details about the failed setup read on.
Source: Medium - How to build a Raspberry Pi thermometer you can access anywhere (a beginner’s guide)
Set up the Raspberry
The offical Getting started with the Raspberry Pi guide is everything you need to get the pi up and running.
For this tutorial I’ve used NOOBS to setup the os.
Once you’ve setup the pi, connect it to the internet via wifi and make sure everything is up and running.
Assemble the thermo sensor
The thermo sensor must be connected with the gpio interface.
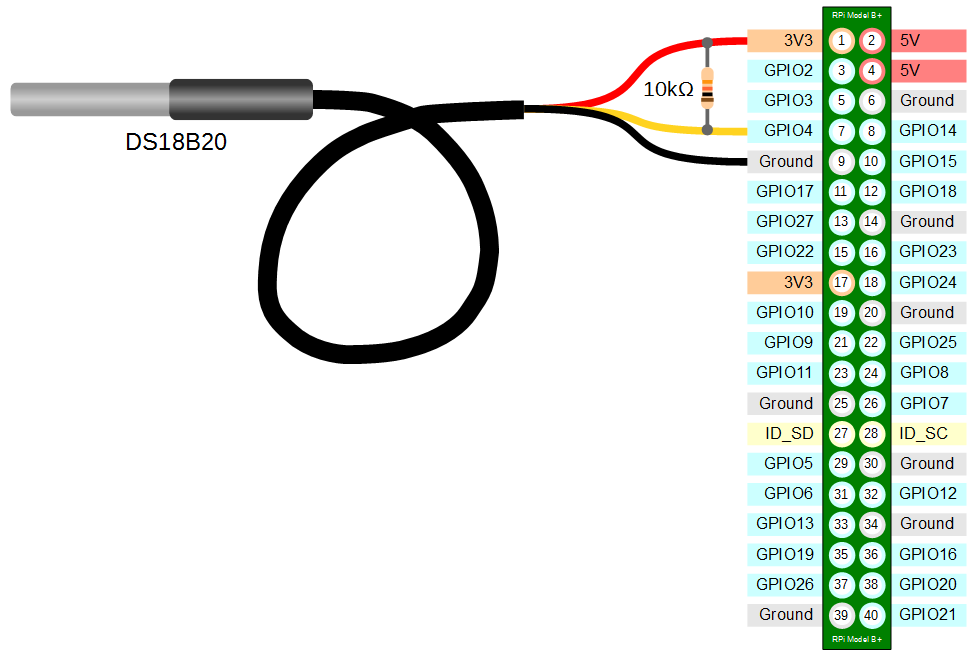
I got help from a friend to solder the resistor and wires.
Mobile internet connection
Edit: Sadly I was not able to setup the GSM module. As mentioned in the first chapter the provided python library did not work for me. Also it turned out that in comparison to the 3G and LTE modules you have to write an extensive set of low level commands in order to communicate with the GSM module. So it so not a plug’n play solution. Despite this drawbacks I’ve written down the steps until I failed with the setup.
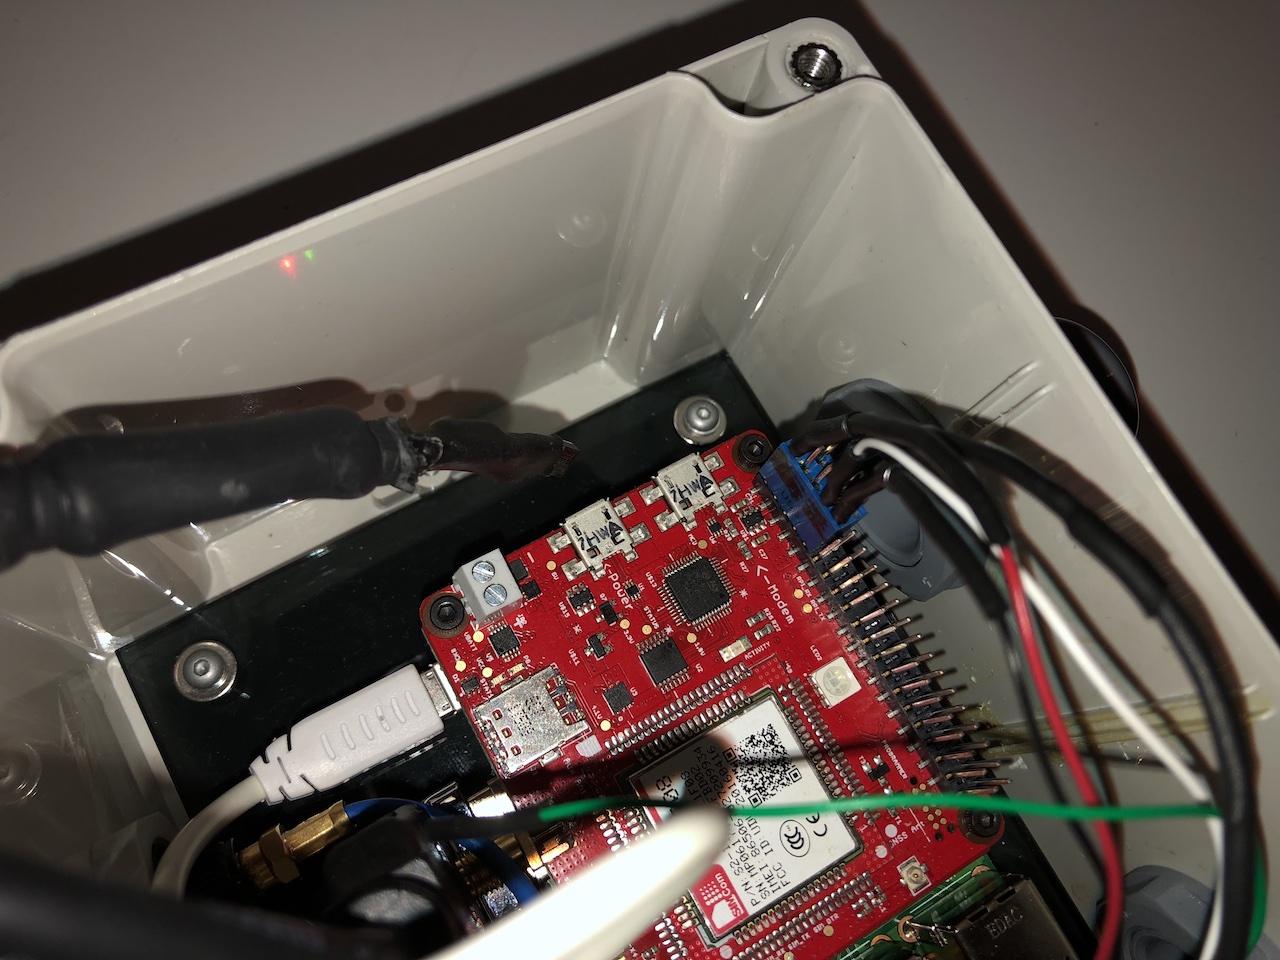
Connect the pi
The GSM module is literally a hat for the Rasperry Pi.
- Stack it on top of the Pi
- Insert the SIM
- Plug the power usb cable to the Power port on the hat
- Connect a usb cable from the hat Modem port to the Pi
Important: The Pi will be powered by the hat.
- Then boot the Pi
To enable communication between the Pi and the hat, we need to enable the UART interface.
git clone https://codeberg.org/janikvonrotz/IOTBit_GSM.git
cd IOTBit_GSM
chmod +x Uart_Enable_RPi3.sh
sudo ./Uart_Enable_RPi3.sh
Test if the GSM hat responds.
sudo apt-get install minicom
minicom -D /dev/serial0
If you see Modem ready the installation was a success.
Source: instructables - IOT BIT GSM V1.5 Hat for the Raspberry Pi
Firmware update
The GMS hat might require a firmware update. The update is also included in the cloned repository from the last chapter.
Run the updater.
cd ~/IOTBit-GSM/IOTBit-GSM_Firmware_Updater
sudo python Firmware_Updater_IOT.py
Enter: /dev/serial0
If the programm finishes with Verification ok the upgrade was successful.
Edit: This is how far I got. The scripts part of the IOTBit_GSM repo did not work for me. Instead I’ve setup the Huawei E5330 - Mobile broadband router, which worked perfectly.
Read the temperature
Rasperry Pi will communicate with the sensor using the 1-Wire protocol. It is already installed. However, the gpio interface must be enabled to allow a sensor connection.
Enable the gpio interface by creating the following entry.
/boot/config.txt
...
dtoverlay=w1–gpio
Load the 1-Wire drivers by adding two modprobe commands to the modules config.
/etc/modules
...
modprobe w1-gpio
modprobe w1-therm
Reboot the pi.
sudo reboot
Look up the device and output a temperature reading.
cd /sys/bus/w1/devices/
ls
cd 28-00000XXXXXXX
cat w1_slave
The temperature should be showed after t= in power of 100.
Source: Circuit Basics - Raspberry Pi ds18b20 temperature sensor tutorial
Set up the api
In the second part of the tutorial we are going to setup a simple web application to retrieve and store the temperature readings. This part requires advanced knowledge about creating and running web applications.
First signup for a mLab account and create a new database and user.
Write down the database connection string.
Then download the example api project.
git clone https://codeberg.org/janikvonrotz/lorauna-api
cd lorauna-api
touch .env
vi .env
Read the README.md file and set the environment variables accordingly.
The example project not only allows to store temperatures, but also other data objects.
Below snippets are listed, which should provide you a better understanding of what is relevant for storing temperature data in the example project.
The schema files describes the data properties and methods that are used to save a temperature measurement.
schema.js
type Temperature {
    _id: String
    created: Date
    value: Float
}

type Query {
    allTemperatures: [Temperature]
}
type Mutation {
    createTemperature(value: Float): Temperature
}
The resolver file actually implements the methods.
resolver.js
...
Query: {
    allTemperatures: async (root, args, context) => {
        return (await context.db.collection('temperature').find({}).sort({created: -1}).toArray()).map(prepare)
    },
},
Mutation: {
    createTemperature: async (root, args, context) => {
        args.created = new Date()
        let res = await context.db.collection('temperature').insertOne(args)
        return prepare(res.ops[0])
    },
}
...
The example project can be deployed using now by ZEIT or any other deployment service (like Heroku, Netlify, DigitalOcean, …).
Script for sending temperature data
If you were able to deploy the example api, you can now create a script that acutally sends the data from the Raspberry Pi.
The script requries the bc binary, install it with yum sudo apt install bc
/home/pi/sendTemperatureData.sh
# get temperature data from sensor
data=$(cat /sys/bus/w1/devices/28-00000XXXXXXX/w1_slave | grep 't=' | cut -d "=" -f 2)

# convert into float
data=$(echo "scale=3;$data/1000" | bc -l)

curl \
  -X POST \
  -H "Content-Type: application/json" \
  --data '{ "query": "mutation { createTemperature(value: '$data') { _id, created } }" }' \
  https://example.now.ch
Make sure the script is executable and give it a try.
cd ~
chmod +x sendTemeperatureData.sh
./sendTemeperatureData.sh
Configure a cron job
Then script should be executed repeatedly.
Login with the pi user and edit the crontab file.
crontab -e
Add the following entry to the crontab file, it will run the script every ten minutes.
*/10 * * * * /home/pi/sendTemperatureData.sh
Query the thermo data
If you successfully sent temperature data, you can now query the api.
Open the graphql playground in your browser https://example.now.sh/ and enter the following query.
query {
  allTemperatures {
    _id
    value
    created
  }
}
On the right side all temperature readings are listed.
Create a chart
I have created another example app for visualizing the temperature data.
Same procedure here. Clone the react example app and update the .env file.
git clone https://codeberg.org/janikvonrotz/lorauna
cd lorauna
touch .env
vi .env
Now you can deploy the application with now or run the project locally.
Running the project locally requires the yarn package manager.
# install dependencies
yarn
# run the dev server
yarn dev
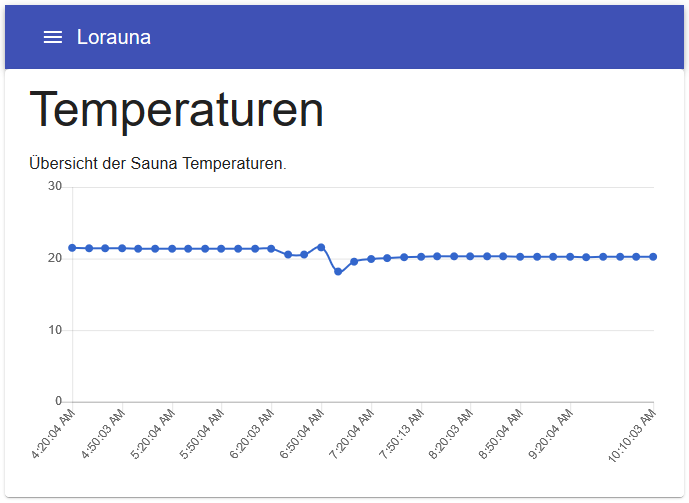
Open the app in your browser and navigate to /temperatures.
Now a chart like the one below should be showed.
Questions
Any questions? Let me know if you were able to follow this tutorial or got stuck somewhere. I am glad to help you.
Category: makerTags: rasperry-pi , maker , thermo-sensor , electronics , graphql , react
Edit Page / Show Statistic