2 min read
Stock market analysis with R
R is a programming language designed for statistical computing. I recently bought a few stocks and decided to analyse some trends based on the current stock data. So here’s my first contact with R and a stock analysis.
An R analysis is composed of a bunch commands which can be drawn together to a script. The example belowsuses the quantmod libaray to download stock market data. Further I’v load the data into a chart and add indicators such as the Bollinger Band to it.
# load library
require("quantmod")
require(TTR)

# setup stock
setSymbolLookup(VW=list(name="VOW.DE", src="yahoo"))

# download stock data
getSymbols(c("VW"))

# create chart
chartSeries(VW, subset="last 3 months")

# add indicators
addMACD()
addBBands()
And here is the output built by R:
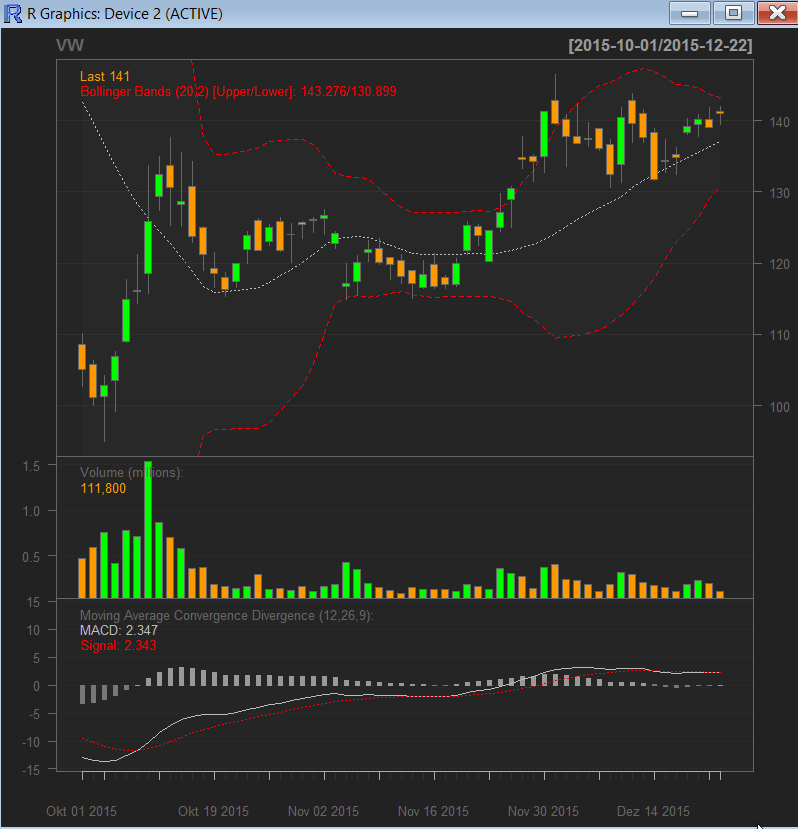
The BBand shows how volatile the market or the stock is. The wider the band the higher is the volatility. The tightening of the bands is often used by technical traders as an early indication that the volatility is about to increase sharply.
I’ve also added the moving average convergence/divergence (MACD) which is a trend-following momentum indicator that shows the relationship between two moving averages of prices.
There are three common methods used to interpret the MACD:
Crossovers - As shown in the chart above, when the MACD falls below the signal line, it is a bearish signal, which indicates that it may be time to sell. Conversely, when the MACD rises above the signal line, the indicator gives a bullish signal, which suggests that the price of the asset is likely to experience upward momentum.
Divergence - When the security price diverges from the MACD. It signals the end of the current trend.
Dramatic rise - When the MACD rises dramatically (shorter moving average (grey) pulls away from the longer-term moving average (red)) that is a signal that the security is overbought and will soon return to normal levels.
Traders also watch for a move above or below the zero line because this signals the position of the short-term average relative to the long-term average.
Categories: StatisticsTags: R-language , statistics
Improve this page
Show statistic for this page