1 min read
How to debug your Node.js application
Recently I’ve started developing with Node.js. As a beginner I had to set up an IDE which meets my requirements such as debugging code. I’ve tried several IDE’s such as Microsofts’s WebMatrix or Eclipse Node.js extension. But all of them literally sucked, they were are a pain to install or didn’t work properly.
Luckily I came along this project: https://github.com/node-inspector/node-inspector
It’s a Node.js debugger that runs in your browser! That means you can still use your the code editor you’re into and debugging the running code directly in your browser (chrome or opera so far). That’s totally awesom! Isn’t it?
To get started with node inspector install these tools:
To install node inspector run these commands in your project folder from the command line:
// install node inspector globally as developer dependencies

npm install -g node-inspector --save-dev

// start debugging you app

node-debug app.js
Your browser will open the developer console on the debugging page now.
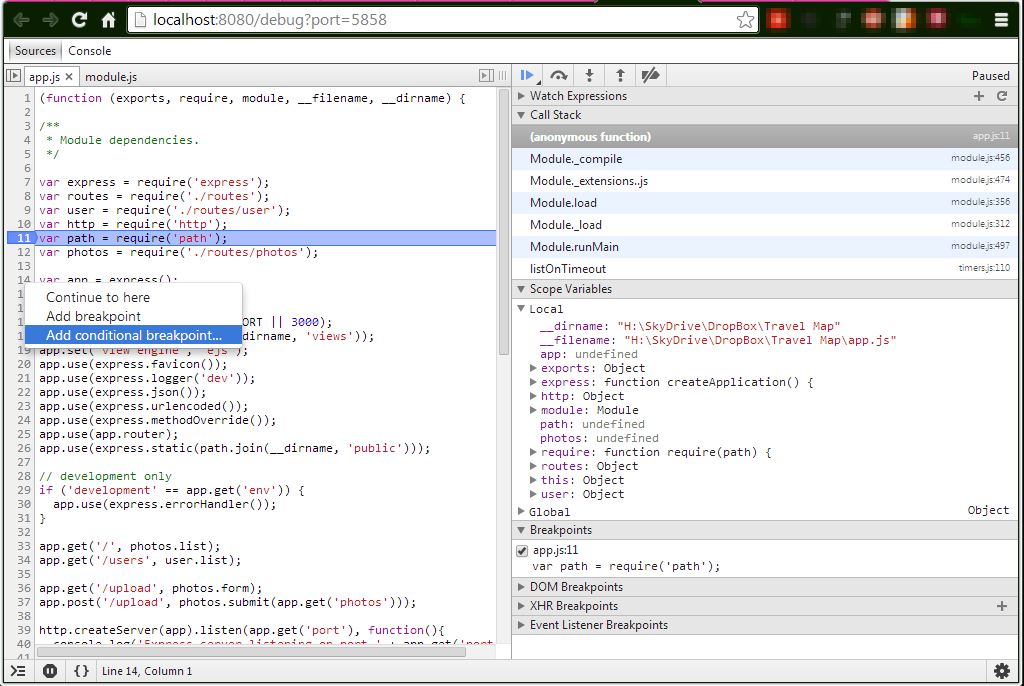 PS: It is even possible to edit the code live in the browser!
Tags: debugging , inspector , javascript , nodejs
Edit Page / Show Statistic