4 min read
Monitor cron jobs with Prometheus, Grafana and Node exporter
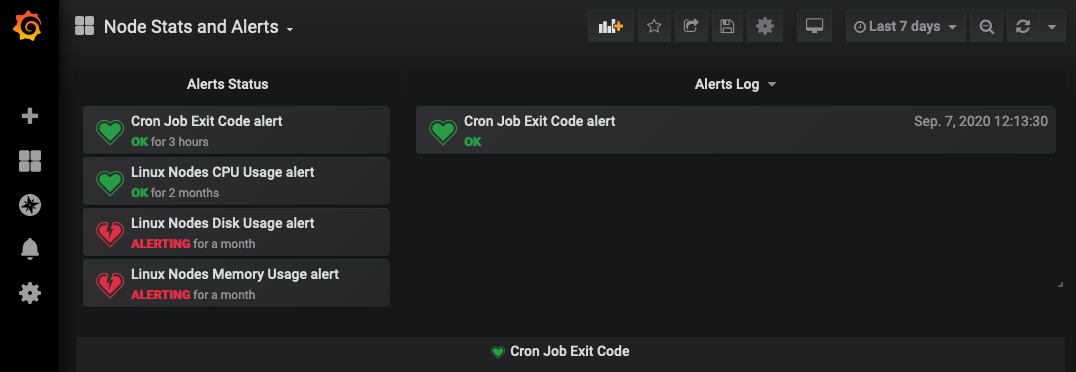
Nobody wants to be notified by email anymore, especially if its a failed cron job. We have advanced monitoring systems that tell if somethings wrong. In my case I use Grafana and Prometheus and Node exporter to collect host metric, visualize them and send out alerts. Usually, one would set up an exporter to monitor an new piece of software, but for cron there isn’t any exporter available. In contraire there are a lot of online service to monitor your cron jobs, such as Cronitor.io. But we do not want to add another dependency for simply monitoring cron jobs.
In this tutorial I will elaborate on how I look after cron jobs with Prometheus and Grafana. We are going to configure the textfile collector of the Node exporter, define custom metrics and visualize them in a Grafana dashboard.
I assume that there is machine running with cron jobs. This machine has multiple cron jobs and a configured Node exporter. The Node metrics are scrapped by Prometheus and visualized in Grafana.
First, we are going to add a bash script to write custom Node exporter metrics. Copy the script below to the host.
/usr/local/bin/write-node-exporter-metric
#!/bin/bash

# Display Help
Help() {
    echo
    echo "write-node-exporter-metric"
    echo "##########################"
    echo
    echo "Description: Write node-exporter metric."
    echo "Syntax: write-node-exporter-metric [-n|-c|-v|help]"
    echo "Example: write-node-exporter-metric -n cron_job -c \"Renew certs for proxy01\" -v 0"
    echo "options:"
    echo "  -n    Reference of custom metric type. Defaults to 'cron_job'"
    echo "  -c    Code for metric value."
    echo "  -v    Value of metric."
    echo "  help  Show write-node-exporter-metric help."
    echo
}

# Show help and exit
if [[ $1 == 'help' ]]; then
    Help
    exit
fi

# Process params
while getopts ":n :c: :v:" opt; do
  case $opt in
    n) TYPE="$OPTARG"
    ;;
    c) CODE="$OPTARG"
    ;;
    v) VALUE="$OPTARG"
    ;;
    \?) echo "Invalid option -$OPTARG" >&2
    Help
    exit;;
  esac
done

# Fallback to environment vars and default values
: ${TYPE:='cron_job'}

[[ -z "$CODE" ]] && { echo "Parameter -c|code is empty" ; exit 1; }
[[ -z "$VALUE" ]] && { echo "Parameter -v|value is empty" ; exit 1; }

if [ "$TYPE" == "cron_job" ]; then
    echo "Write metric node_cron_job_exit_code for code \"$CODE\" with value $VALUE."
    ID=$(echo $CODE | shasum | cut -c1-5)

    cat << EOF >> /var/tmp/node_cron_job_exit_code.$ID.prom.$$
# HELP node_cron_job_exit_code Last exit code of cron job.
# TYPE node_cron_job_exit_code counter
node_cron_job_exit_code{code="$CODE"} $VALUE
EOF
    mv /var/tmp/node_cron_job_exit_code.$ID.prom.$$ /var/tmp/node_cron_job_exit_code.$ID.prom
fi
And make it executable.
chmod +x /usr/local/bin/write-node-exporter-metric
By default this script writes metric text files to /var/tmp. This folder is watched by Node exporter. Set the textfile collector directory flag --collector.textfile.directory for the Node exporter. If you are using Docker to run the exporter, set the following config:
...
volumes:
  - /:/hostfs
command: '--collector.textfile.directory=/hostfs/var/tmp'
...
Let’s write a custom metric and see if it scrapped by Prometheus.
Run write-node-exporter-metric -c 'Renew certs for proxy01' -v 0 on the command line.
Check the metrics interface of the host and search for node_cron_job_exit_code.
Use this curl command if you want to stick to the console:
curl --silent --user username:password \
  https://host.example.com/node-exporter/metrics | \
  grep node_cron_job_exit_code
If the value has been exposed, open Grafana and explore the metrics.
Create a new panel and use this query:
sum by (instance) (node_cron_job_exit_code)
This query sums all cron jobs exit codes by instance. If the sum is not null something went wrong.
Create an alert that triggers if the metric is greater than 0.
When setting up cron jobs crontab -e from now on you simply have to add the write metric command at end of the line. Here is an example:
45 0 * * 0 /usr/share/cerbot/renew-certs; write-node-exporter-metric -c 'Renew certs for proxy' -v $?
No matter if the job succeeds or fails, the exit code is written and forwarded to Prometheus.
What do you think? Do you like this solution? Let me know how you monitor cron jobs.
Categories: System EngineeringTags: grafana , prometheus , monitoring , cron
Edit this page
Show statistic for this page